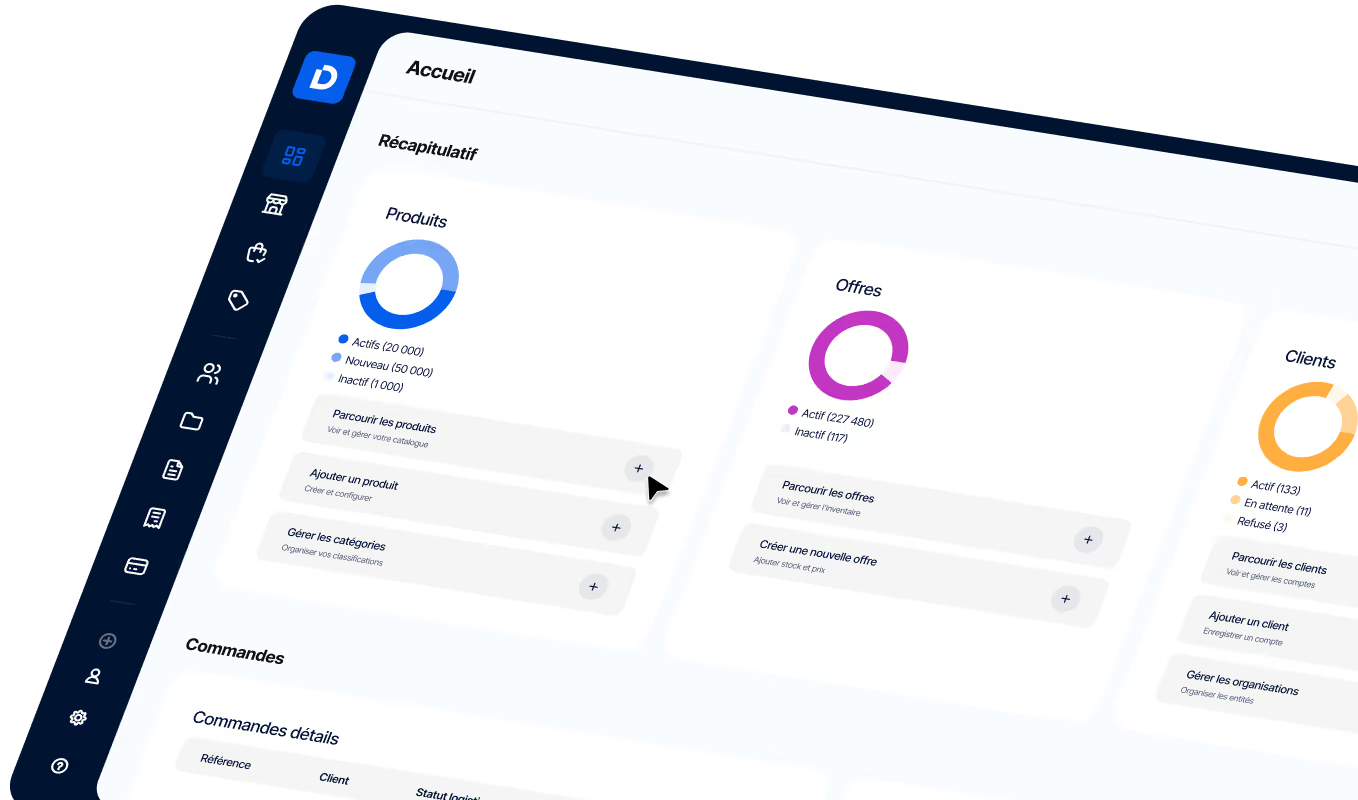
B2B Marketplace KPIs: 10 Essential Metrics
The best-performing B2B marketplaces use a range of key performance indicators (KPIs) to optimize performance and lead their market. With the right metrics in hand, you can streamline operations, build a loyal customer base, and accelerate growth.
.avif)
The B2B marketplaces that perform best use a range of key performance indicators (KPIs) to optimize results and lead their industry. With the right metrics in hand, you can streamline operations, build a loyal customer base, and accelerate growth. This proactive, data-driven approach to business management is a game changer in the highly competitive B2B commerce arena.
Below, we take a closer look at ten marketplace KPIs designed to help your business rise above the competitive noise of B2B eCommerce platforms.
Commercial KPIs to Track for Your Marketplace
Use these key performance indicators to grow revenue, refine pricing tactics, and simplify your sales funnel for maximum profitability.
Gross Merchandise Value (GMV)
Gross merchandise value represents the total value of goods and services exchanged on a platform. It’s a key measure of your business’s overall scale, similar to gross revenue in eCommerce businesses.
You can compare quarter-over-quarter changes to assess GMV growth, identify seasonal trends, evaluate the health and growth of your marketplace, and measure the impact of strategic initiatives such as marketing campaigns, pricing adjustments, and platform improvements.
Marketplace liquidity
Marketplace liquidity is a critical concept for B2B marketplaces. It refers to how efficiently your marketplace facilitates transactions between buyers and sellers.
High liquidity reflects a vibrant marketplace where products and services change hands quickly. Low liquidity, by contrast, can lead to stalled transactions, frustrated users, and a less attractive marketplace overall.
Expert tip: To measure marketplace liquidity, look at metrics such as time to transaction (TTT; the time it takes for an average listing to result in a sale) and the ratio of active buyers to sellers. These indicators show how well supply and demand are balanced, which is essential for keeping the marketplace dynamic.
For example, a marketplace with long transaction times — in other words, low liquidity — might choose to encourage sellers by lowering commission rates or offering discounts to buyers. If TTT drops as a result, you know your efforts helped drive new transactions.
Average basket value
Average basket value (ABV) measures the average amount spent per transaction.
It’s a key indicator of customer buying behavior and product assortment effectiveness.
For example, if you introduce bulk discounts on in-demand items and see ABV rise from $200 to $250, that increase suggests your audience responds to cross-sells and promotions that encourage larger purchases per transaction, and that you should explore new ways to build on that behavior.
Expert tip: You’ll get the best results by combining insights from multiple KPIs. For example, you can compare the increase in basket value with changes in average basket value to make sure larger baskets are actually driving overall sales growth. If ABV doesn’t change, it may mean you’ve achieved larger baskets but pushed buyers to purchase less often, resulting in no net gain.
Conversion rate
Conversion rate refers to the percentage of visitors who make a purchase. It’s a clear test of how effectively the marketplace turns prospects into buyers.
For example, if improvements to your user interface and a simpler checkout flow increase conversion from 2% to 3.5%, that shows the platform changes had a positive impact on customer buying decisions. On the other hand, if conversion rates fall, you may need to rethink — or even roll back — those changes, because they didn’t have the intended effect on your audience.
Traffic-related marketplace KPIs
Understanding and tracking traffic-related KPIs is essential to assess how effectively your marketplace reaches and engages users. Here are three key traffic metrics to guide future decisions.
Number of unique visitors
This foundational metric measures the total number of distinct individuals who visited your marketplace during a given period. It’s an important indicator of your market’s reach and visibility.
It’s also one of the most effective ways to evaluate marketing campaigns and brand awareness efforts. For example, if unique visitors rise from 20,000 to 23,000 per month after a major marketing campaign, that’s a strong sign of success. If the numbers stall or decline, it may be time to adjust your strategy.
Page views
Page views measure the total number of pages viewed on your marketplace. This metric reflects visitor engagement and content relevance.
It’s often best understood in relation to unique visitors. If both metrics rise at the same pace, the reason for the increase in page views is obvious: you simply have more visitors overall. But if page views rise faster or slower than unique visitors, that’s a sign you need to dig deeper and find out how user behavior has changed, for better or worse.
Bounce rate
Bounce rate is the percentage of visitors who leave the marketplace after viewing just one page.
A low bounce rate is desirable, because it shows visitors find the marketplace compelling enough to explore further.
For example, if bounce rate drops after you optimize your landing pages, you can be confident your efforts paid off. By comparing that reduction with changes in sales metrics such as ABV (see above), you can more easily calculate ROI.
Expert tip: If you see a sharp spike in bounce rate over a short period, it may point to a major issue linked to recent updates to your website or platform. Closely monitoring bounce rate is one of the best ways to make sure development teams haven’t accidentally introduced bugs that affect user experience and site performance.
Marketplace KPIs related to customer engagement and satisfaction
As a marketplace, customer engagement and satisfaction are among the most important values for your business to measure. Many vendors are active on multiple platforms, and buyers won’t hesitate to move to more satisfying alternatives.
Here are three crucial key performance indicators for assessing these areas.
Average acquisition cost
Average acquisition cost (AAC) quantifies the spend required to acquire a new customer, and it’s essential for understanding how effective your marketing efforts are.
AAC is especially useful for evaluating marketing campaign performance. For example, suppose you invest $35,000 in one marketing campaign and $55,000 in another. The first campaign brought in 830 new customers, while the second attracted 1,220. Which campaign was more successful?
The AAC for the first campaign is: $35,000 / 830 = $42.17 per customer.
The AAC for the second campaign is: $55,000 / 1,220 = $45.08 per customer.
So the second campaign was more effective. You can use what you’ve learned about your audience and the type of marketing they respond to best to make sure
future investments are even more effective.
NPS score
Net Promoter Score (NPS) is a measure of customer loyalty and satisfaction.
Dubbed "The One Number You Need to Know" by Frederick Reichheld, former director emeritus at Bain & Company, this deceptively simple approach to customer satisfaction correlates strongly with overall business performance.
It’s calculated from responses to the following question: "How likely are you to recommend our company?" "How likely are you to recommend our marketplace to a friend or colleague?"
Scores range from -100 to 100. At -100, everyone is a "detractor" and will actively share their disappointment with others. At +100, everyone is a "promoter" and will gladly recommend you to others. You’ll also encounter many "passives" — customers who are satisfied with your marketplace, but not enthusiastic about it.
For reference, the average NPS score across eCommerce, both B2B and B2C, sits around 40-60, which makes it a good benchmark to aim for first, then exceed.
Collect it often, track it closely, and measure every technical and cosmetic change to your platform against it.
Customer lifetime value
Customer lifetime value (CLV) represents the total revenue a business can expect from a single customer account over the course of its relationship with the company.
For example, if the average customer on your marketplace spends $10,000 per year and your average customer relationship lasts seven years, CLV would be $70,000.
This KPI is useful for making informed decisions about customer retention strategies and how much to invest in acquiring new customers.
In conclusion
By tracking and optimizing these ten key performance indicators, you can improve efficiency, ensure a positive ROI, and grow your customer base and business.
Strategically compare sales, traffic, and customer engagement and satisfaction scores to evaluate your efforts in marketing, interface and user experience, pricing, and new feature development.
This data-driven approach, combined with a SaaS marketplace solution, ensures every decision aligns with your marketplace’s core goals, paving the way for lasting success and a powerful competitive advantage.
The essentials
By tracking and optimizing these ten key performance indicators, you can improve efficiency, ensure a positive ROI, and grow your customer base and business.
Strategically compare sales, traffic, engagement, and customer satisfaction scores to assess your efforts in marketing, user interface and experience, pricing, and new feature development.
This data-driven approach, combined with the use of a SaaS marketplace solution, ensures that every decision aligns with your market’s core goals, paving the way for lasting success and a powerful competitive advantage.


.png)

.jpg)